
The economy fluctuates between intervals of expansion and contraction. Cyclical patterns of growth and recession are inevitable and can occur without warning for indeterminate periods of time. It is incredibly difficult to predict the timing of the next economic cycle, but several top economic indicators provide economists, investors, and policymakers with sophisticated information to make educated assumptions on where the economy is headed. Financial professionals analyze economic statistics to identify potential risks, opportunities, and tradeoffs in the markets.
Gross Domestic Product
The economic growth of a country is measured by Gross Domestic Product (GDP): the market value of all final goods and services produced within a country during a certain timeframe, typically one year. GDP does not include intermediate, used, foreign, or illegal goods and services. It excludes transfer payments made by the Federal Government.
GDP is calculated by the formula, Y=C+I+G+NX.
- Y= Gross Domestic Product
- C= Consumption (Private Spending)
- I= Investment (Business’ Capital Spending)
- G= Government Spending (Public Spending)
- NX= Net Exports (Exports – Imports)
Weights of each GDP component vary depending upon the country’s spending, investing, and public policy. Bloomberg notes the U.S. is consumer-driven as consumption accounts for roughly 70% of GDP, meanwhile 50% of China’s GDP stems from investment as an infrastructure-focused country, and 58% of GDP in Denmark, “known for its renowned social safety net,” comes from government spending. There is an important distinction between nominal and real GDP. Nominal is the current monetary value, yet real takes into account the effects of inflation: (Real GDP =Nominal GDP – Inflation Rate). Real GDP is a better measure of overall economic health as it provides a true representation of growth. The Bureau of Economic Analysis publishes GDP one month after each quarter-end. It is the last of the top economic indicators to be published making it inconvenient for investors. However, it is still an important tool for business and investment strategy as it offers a glimpse of the overall economy.
Inflation
Inflation is the general increase in prices of goods and services which diminishes the purchasing power of money, i.e., a dollar buys less tomorrow than today. It is interpreted through the Consumer Price Index (CPI) which measures what the average person is most likely to consume. The Bureau of Labor Statistics gathers data on the basket of goods and services purchased by individuals and publishes CPI data monthly. Inflation statistics are released later than other key economic indicators (except GDP) making it less timely for investors in decision-making. Nonetheless, CPI is the primary measure for inflation and illustrates price movement. Inflation is caused by increased consumer spending and erodes the value of bonds as coupon payments are fixed. When interest rates are low, inflation increases; when interest rates are high, spending decreases, causing deflation (decrease in prices). Equities are viewed as a hedge toward inflation since residual earnings can grow freely, offsetting high prices. Investment decisions are made after taking into consideration CPI data and the potential implications of inflation in the stock market.
Unemployment
The labor force includes all people that are employed or willing to be employed. The percentage of the labor force that is without a job is the unemployment rate. Individuals not actively seeking a job (sitting on the couch eating potato chips and watching T.V.) are excluded from this calculation as they are not considered to be in the labor force. Generally, when the economy is in a recession, unemployment rises; when the economy is booming, unemployment falls. Additionally, government benefit payments increase when unemployment is higher. Consequently, the reigning political party in the executive branch is held responsible for the unemployment rate. Because of this, unemployment is deemed the most political of the indicators. Since 1948, the average yearly unemployment rate has been 5.77% (Bureau of Labor Statistics). Unemployment will always exist because the supply of jobs will never realistically be identical to the demand for jobs. The Federal Government’s objective is to keep unemployment around its natural rate and neutralize any spikes during economic contraction. When fewer people have jobs, spending decreases, resulting in lower business earnings and a drop in stock market prices. Investors monitor unemployment closely to prepare for any sudden changes and quickly change their positions.
Business Confidence
The Institute for Supply Management (ISM) conducts a monthly survey on expected business purchases and publishes the data on the first business day of the following month. This Purchasing Managers’ Index (PMI) summarizes this data which shows the demand for goods and services of businesses and subsequently indicates overall business confidence. As the first key economic indicator released each month, PMI is the timeliest for investors. Historically, PMI—as it measures expected manufacturing purchases by businesses—has closely reflected the direction of GDP. When PMI increases, so does GDP shortly after, and vice versa. As PMI is released monthly, investors interpret the expected business purchases to predict earnings that reflect stock market performance.
Housing Starts
Housing starts measure the new construction of residential homes. Generally, consumers assume a 30-year fixed-rate, but some lenders issue terms lasting anywhere from 8 to 29 years (Credible). Although housing accounts for only 3% of U.S. GDP (Bloomberg), there is a residual effect beneath the surface. When consumers buy houses, they purchase necessary goods to complement their new homes (e.g., paint, kitchen, furniture, appliances, etc.) causing greater consumer spending. Federal Reserve Economic Data releases statistics for housing starts monthly and has consistently shown a strong, positive correlation to GDP. The housing market has significantly recovered since the 2007-2008 financial crisis when many subprime borrowers defaulted on their loans. The Federal Home Loan Mortgage Corporation and Federal National Mortgage Association—better known as Freddie Mac and Fannie Mae, respectively—are the two dominant institutions in the secondary mortgage market. The two federally backed home mortgage companies were created to “make the mortgage market more liquid, stable, and affordable through the purchase and guarantee of mortgages issued by lenders in the secondary market.”
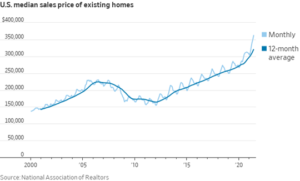
Recently, real estate has been scorching hot as “ultralow mortgage-interest rates is expected to continue pushing home prices higher” (Wall Street Journal). In the above figure from the National Association of Realtors, we can observe the U.S. median home price hit a record high of $363,300 in June 2021.
Economic Decision-Making
Many statistical data sets forecast the health of an economy, but this article highlights the top economic indicators. Investors should be cognizant of economic data in making investment decisions; some may even seek professional advice. Demand Wealth is a hybrid robo-advisor and offers investment products and solutions tailored to the individual’s values, investment goals, and risk tolerance. There are over a dozen risk-based portfolios we offer for people of varying values and interests, e.g., Cruelty Free, Christian, and Blockchain. Schedule a zoom consultation with one of our experienced advisors to decide what is suitable for you in any economic cycle.